
|
|
Support AssetsTools & TechniquesRiskNav |
|||
 Standard Process Compliance Policy
Taxonomies
Training Examples |
For additional information on risk management best practices and lessons learned, please see the Risk Management topic and articles in the online MITRE Systems Engineering Guide. About RiskNav RiskNav®, originally produced for the U.S. government, is designed to capture, analyze, and display risks at a project or enterprise level. RiskNav® is currently deployed throughout the intelligence community, ESC, FAA, Census and other MITRE sponsors. MITRE transferred the RiskNav technology to two licensee companies NMR Consulting, Inc. and KEYW (formerly Sycamore US). Each company has a commercial product based on RiskNav available (Highwire and RMT respectively). You can find information on their products at:
Highwire: http://www.nmrconsulting.com/services/risk-management/ Risk Mitigation Tool: https://www.keywcorp.com RiskNav presents the risk space in both tabular and graphical form. The tabular form, shown below, presents key information for each risk and allows the risk space to be filtered and sorted to focus on the most important risks. 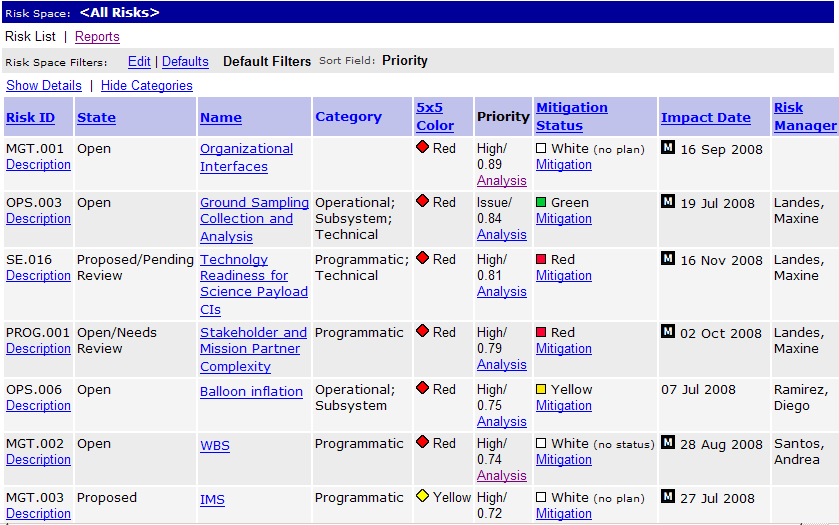
RiskNav Summaries Key Risk Information RiskNav uses a weighted average model that computes an overall score for each identified risk. The risk priority is a weighted average of the timeframe (how soon the risk will occur), probability of occurrence, and the impact (cost, schedule, technical). This score provides a most-to-least critical rank order of the risks. Formally, this scoring model originates from the concept of linear utility, where the more important risks get higher numbers and the gaps between the numbers correspond to the relative strengths of the differences. 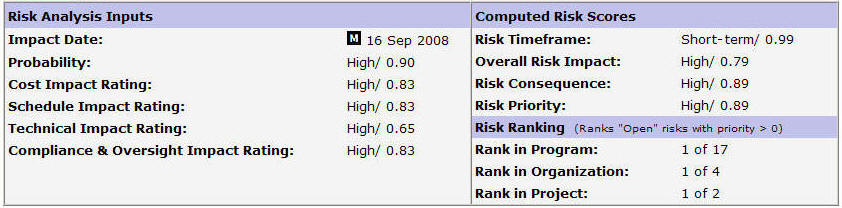 RiskNav uses a Scoring Model to prioritize Risks In graphical form, RiskNav represents three key aspects of each risk in the risk space: risk priority, probability, and the mitigation/management status. Data points represent risks, and the color of a box indicates the status of the mitigation action (White: no plan; Red: plan not working; Yellow: may not work; Green: most likely successful; Blue: completed successfully; Black: actions will be started at a later date). Data points can be selected to show detailed Risk Information about the analysis, who is working the management actions, the status, and other information. 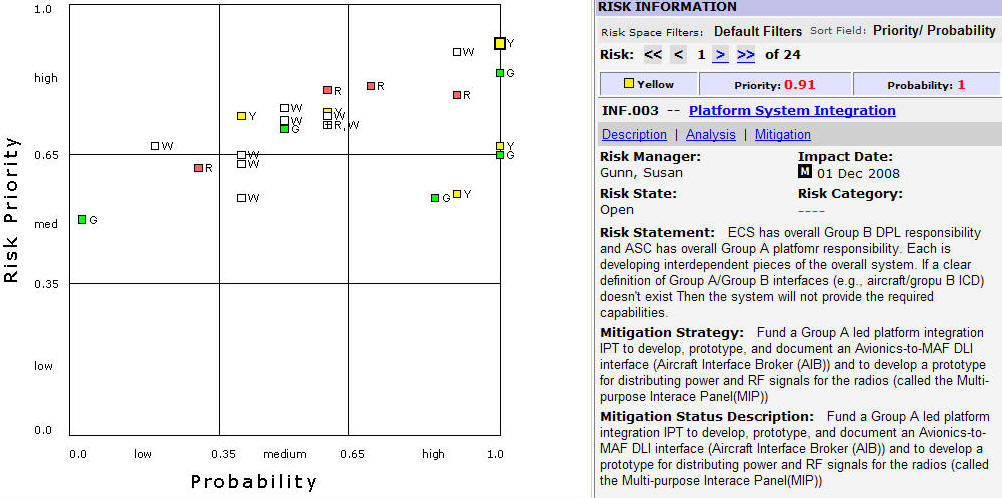 RiskNav Visualizes the Risk Space showing both Risk Priority and Mitigration Status RiskNav also displays a 5x5 Frequency Chart showing the number of risks in each square of a 5x5 matrix of probability versus consequence ranges. The Red cells contain the highest priority risks. The Yellow and Green cells contain medium and low priority risks, respectively. RiskNav incorporates an admin capability that allows the chart's probability and consequence ranges to be customized. Clicking on a cell provides a detailed list of the risks in that cell. The All Red, All Yellow and All Green icons at the top of the chart can be used to list risks in all cells of a particular color. 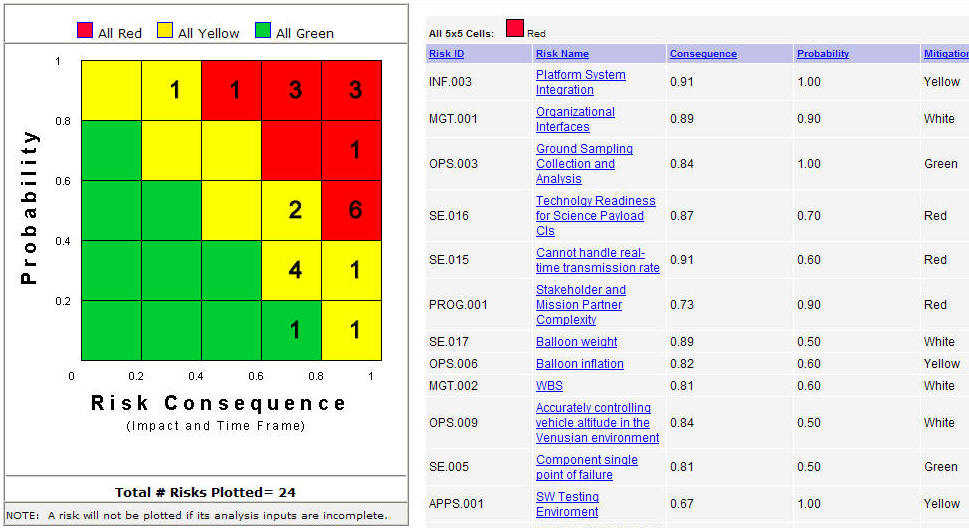 RiskNav Displays a 5x5 Frequency Chart to Identify High Priority Risks If you are a government/DoD user and would like additional information on RiskNav, please contact risknav@mitre.org. |