|
|
Support AssetsProceduresAffinity Diagrams |
|||
 Standard Process Compliance Policy
Taxonomies Tools & Techniques Training Examples |
What is it?
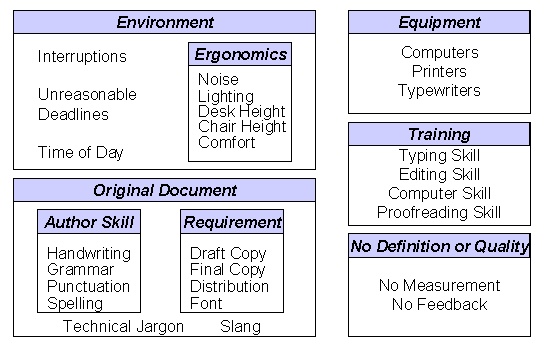
How to use it Generate ideas. Use an idea-generation technique to identify all facets of the problem. Use index cards or sticky-back notes to record the ideas. Cluster your ideas (on cards or paper) into related groups. Use questions like "Which other ideas are similar?" and "Is this idea somehow connected to any others?" to help you group the ideas together. Create affinity cards. For each group, create an affinity card, a card that has a short statement describing the entire group of ideas. Cluster related affinity cards. Put all of the individual ideas in a group under their affinity card. Now try to group the affinity cards under even broader groups. You can continue to group the cards until your definition of "group" becomes too broad to have any meaning. Create an affinity diagram. Lay out all of the ideas and affinity cards on a single piece of paper or a blackboard. Draw outlines of the groups with the affinity cards at the top of each group. The resulting hierarchical structure will give you valuable insight into the problem. Affinity Diagram Example
The following diagram helped them to focus on areas for further analysis. Typographical Errors |